
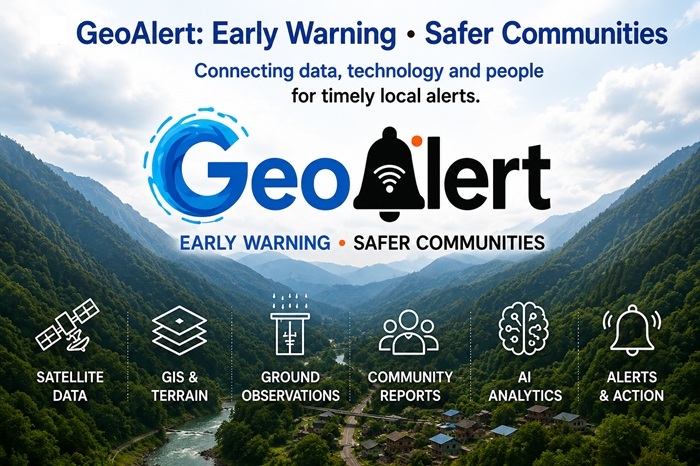
GeoAlert explores how satellite observations, GIS, local monitoring and community reporting can be combined to improve early warning for landslides and floods.
From Rainfall to Local Risk
Sri Lanka experiences repeated landslides, river flooding and urban flash floods during periods of intense and prolonged rainfall. Rainfall is often the main trigger, but rainfall alone does not explain where damage will occur. The same rainfall event can have very different effects from one location to another. A steep saturated slope, a narrow drainage path, a low-lying settlement and an urban road with blocked drains all respond differently. This is why local early warning needs more than a weather forecast. It needs to understand the terrain, drainage, recent rainfall and what is actually happening on the ground.
Rainfall triggers, terrain defines risk, and communities observe change.
This simple principle is at the centre of the GeoAlert approach.
Why Satellite Data Matters
Satellite data gives the wider environmental picture. It can provide information on rainfall, cloud systems, vegetation, land cover, surface water and terrain across large areas. This is important in Sri Lanka because hazard monitoring has to cover mountain regions, river basins, rural communities and cities. It is not practical to install dense monitoring equipment everywhere.
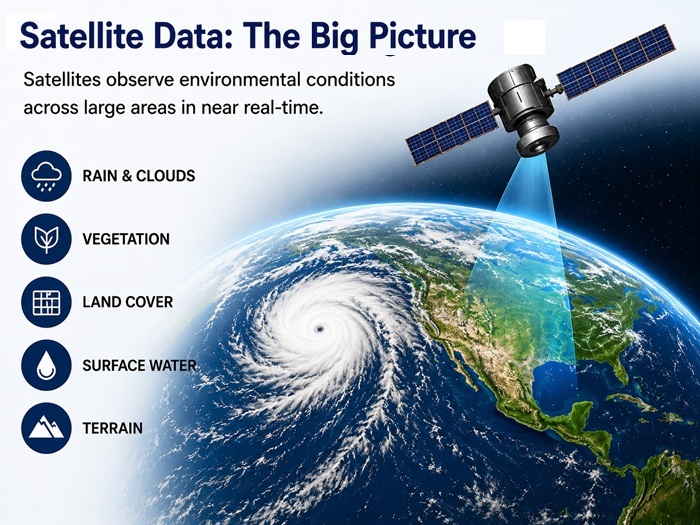
Satellite information is therefore useful for identifying the wider conditions around a location. However, it should not be treated as the complete warning system.
A satellite may show heavy rainfall over a district, but it may not tell us whether a drain beside a particular road is blocked, whether water is crossing a village access road, or whether a new crack has appeared on a slope.
For that reason, GeoAlert combines satellite information with ground observations and GIS.
Terrain Defines Where Risk Develops
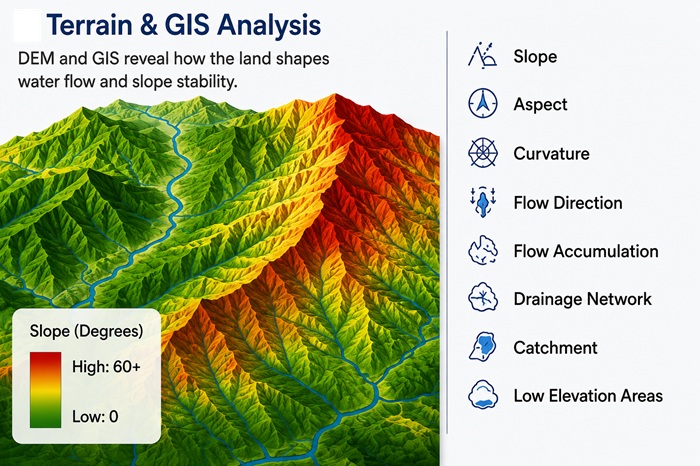
Digital elevation models provide the basic terrain information needed to understand how water moves across the landscape.
GIS can use elevation data to derive:
- Slope
- Aspect
- Terrain curvature
- Flow direction
- Flow accumulation
- Drainage networks
- Catchment boundaries
- Low-lying areas
For landslide assessment, slope, curvature, drainage and rainfall can help identify locations where instability may develop. For flood assessment, drainage convergence, catchment behaviour, low elevation and rainfall accumulation become important.
GIS as the Integration Layer
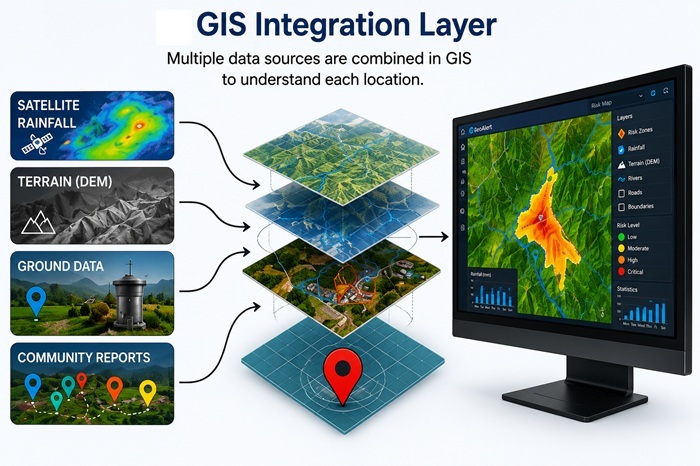
GIS is more than the map shown at the end of the analysis. It provides the spatial framework that connects the different data sources.
Consider a community report that says, “heavy runoff is crossing the road.”
Once that report has a location, the system can examine the terrain above the road, recent rainfall, upstream drainage, nearby reports and known hazard conditions.
The observation becomes more useful because it is linked to the surrounding landscape.
Ground Truth Comes from the Field
Remote data needs local verification. Ground truth may come from instruments, field officers or community members.
Useful observations can include:
- Rainfall measured by a local gauge
- Drainage blockage
- Unusual runoff
- Rapidly rising stream levels
- Surface cracks
- Minor slope failures
- Soil movement
- Water appearing in unexpected locations
People who live in a location often know what is normal and what is unusual. This local knowledge is valuable, especially when it is recorded with a location and time.
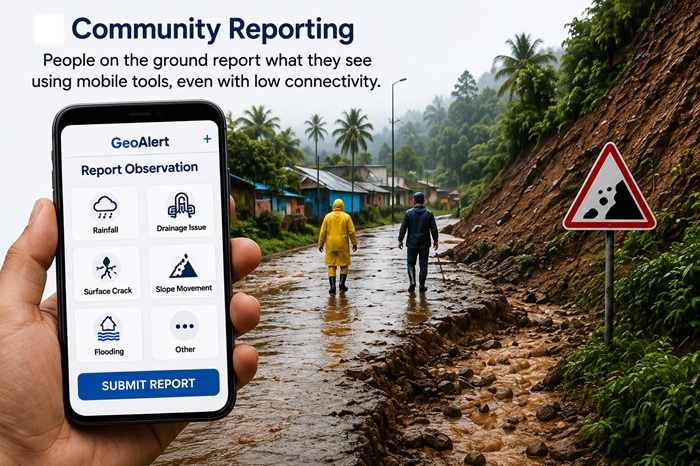
GeoAlert therefore treats communities as part of the monitoring network, not only as recipients of warnings.
Rainfall as the Main Trigger
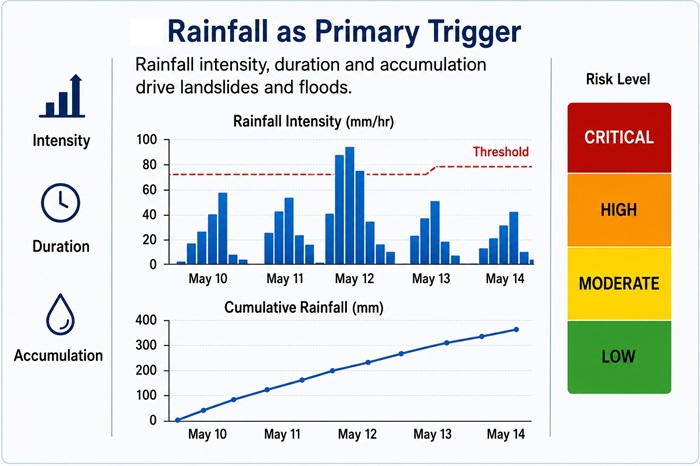
The GeoAlert model gives particular attention to rainfall intensity, duration and accumulation.
A short period of heavy rain may cause rapid urban flooding. Several days of continued rainfall may progressively saturate a mountain slope. The effect depends on both the rainfall pattern and the local terrain.
The system therefore uses rainfall as a time-series input rather than looking only at a single daily value.
Where AI Can Help
Risk changes over time, and several variables may change together. This is where AI can assist.
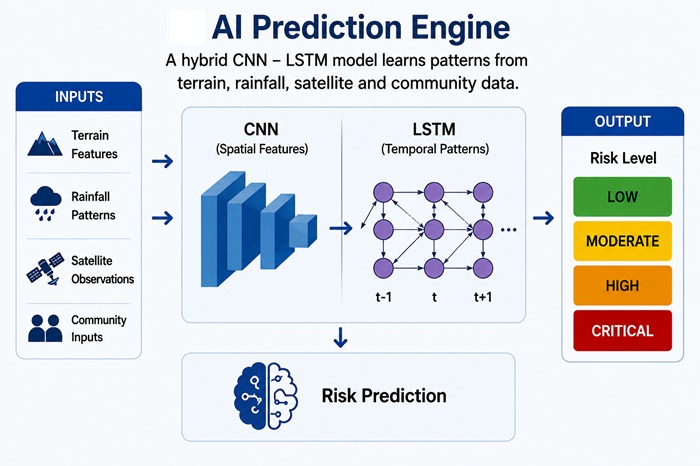
The GeoAlert concept proposes a hybrid CNN–LSTM model that combines terrain features, rainfall patterns, satellite observations and community inputs. The aim is to classify changing risk into levels such as low, moderate, high and critical.
The technical value of AI is not the label itself. Its value is in identifying relationships across several spatial and time-based inputs that may be difficult to represent using fixed rules alone.
Given what is known about this location, recent rainfall and current field observations, is the risk increasing?
AI-Assisted Early Warning
GeoAlert is intended as an AI-assisted warning system. The AI model supports risk assessment, but life-safety decisions should not depend on an unverified model output alone.
A practical system needs several checks. Sensor data needs validation. Community reports need context. Model output needs comparison with rainfall and terrain conditions. Significant alerts may also require review by responsible authorities.
AI assists the assessment. People remain part of the decision.
A Simple GeoAlert Data Flow
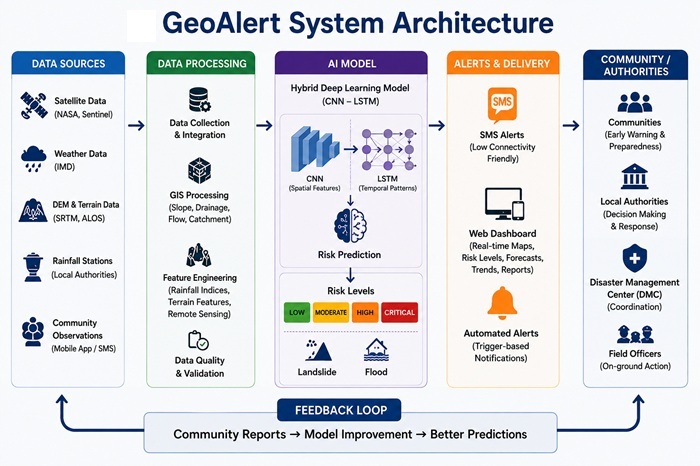
The basic information flow can be described as:
- Collect rainfall, weather and satellite information.
- Process terrain and drainage information in GIS.
- Receive local sensor readings and community observations.
- Combine the inputs by location and time.
- Estimate local risk using GIS analysis and AI-assisted models.
- Present the result as a risk level and map.
- Deliver alerts through mobile Internet, web dashboards and SMS.
- Collect field observations after the event for validation.
This architecture is consistent with the GeoAlert prototype proposed in the project concept, which combines GIS-based multi-hazard mapping, AI prediction, community monitoring and dashboard-based alerts. :contentReference[oaicite:1]{index=1}
The Internet Connects the Warning Chain
The system depends on connectivity between the people and systems involved.
Satellite and weather information may come from remote data services. Community reports may arrive through a mobile interface. Local monitoring devices may send observations over the Internet. GIS and prediction services process the information, while warning messages return to communities and authorities.
Observe → Connect → Analyse → Verify → Alert → Act
Not every community needs the same technology. Where smartphones and mobile Internet are available, richer maps and reporting tools can be used. Where connectivity is limited, SMS can still carry a short warning.
This is important for rural and underserved communities. The technology has to work with the connectivity that people actually have.
Local Models Are Important
Sri Lanka has very different hazard environments within a relatively small area.
A mountain pass in the Central Highlands, a settlement beside the Kelani River and a flash-flood location in central Colombo should not be treated as the same problem.
GeoAlert therefore proposes local calibration using DEM data, rainfall records, historical disaster information and community observations. Thresholds can then be adjusted according to regional terrain and rainfall behaviour.
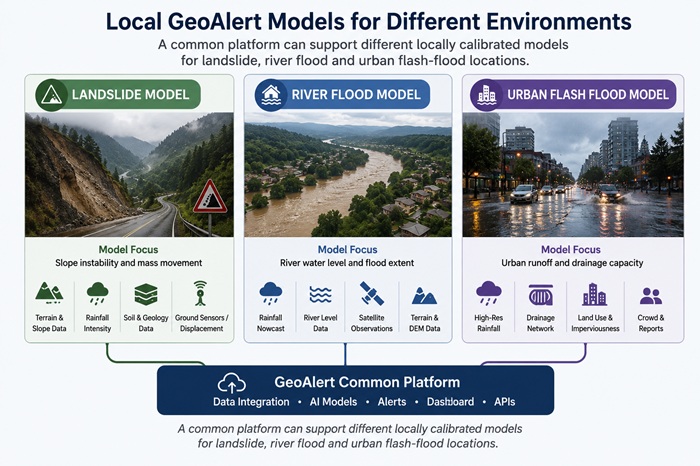
The concept proposes pilot locations covering both landslide and flood risk, with local DEM, rainfall and historical disaster data combined with community observations. :contentReference[oaicite:2]{index=2}
Communities Are Part of the System
Early warning is more useful when communities understand where the information comes from and how to respond to it.
Schools, community organisations and local authorities can support monitoring and reporting. They can identify local risk points, observe drainage behaviour, record rainfall and confirm whether an alert reflects actual field conditions.
This also creates a practical feedback loop between the model and the field.
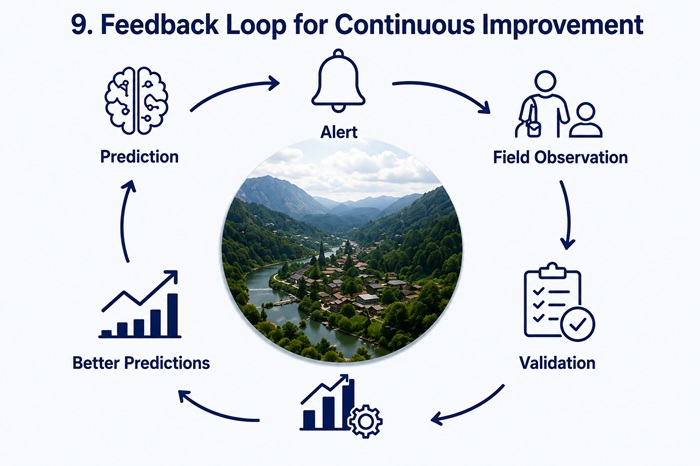
Closing the Feedback Loop
Every warning provides an opportunity to improve the system.
After an event, the system should ask:
- Did flooding occur where it was predicted?
- Did the slope show signs of movement?
- Was the rainfall threshold appropriate?
- Did community reports confirm the warning?
- Was the warning early enough to be useful?
- Were there locations that the model missed?
These observations can be added to the local data record and used in later model development.
From Data to Community Action
An effective warning system cannot depend on a single sensor, satellite product or AI model. It needs several sources of evidence that support each other.
- Satellite data gives the regional picture.
- Rainfall monitoring identifies the main trigger.
- DEM and GIS show where risk can develop.
- Ground monitoring provides local measurements.
- Community observations provide local ground truth.
- AI helps analyse changing patterns.
- Internet and SMS connect the information to people who need it.
The GeoAlert project brings these parts together into one local early-warning approach. Its proposed prototype includes GIS-based hazard mapping, AI-supported prediction, community reporting and dashboard-based alert delivery under field conditions. :contentReference[oaicite:3]{index=3}
The Test That Matters
The success of GeoAlert should not be measured only by model accuracy or the number of datasets in the platform.
Did the right information reach the right community early enough for people to take action?
If satellite information, GIS, ground truth and community participation can improve that decision, then technology has served its real purpose.
GeoAlert is being developed around this objective: using Internet-enabled technology to turn environmental data into practical local information that can help communities prepare, respond and save lives.
TechSights: GeoAlert & Climate Tech · GIS · Artificial Intelligence · Community Technology · Early Warning